Datasets available

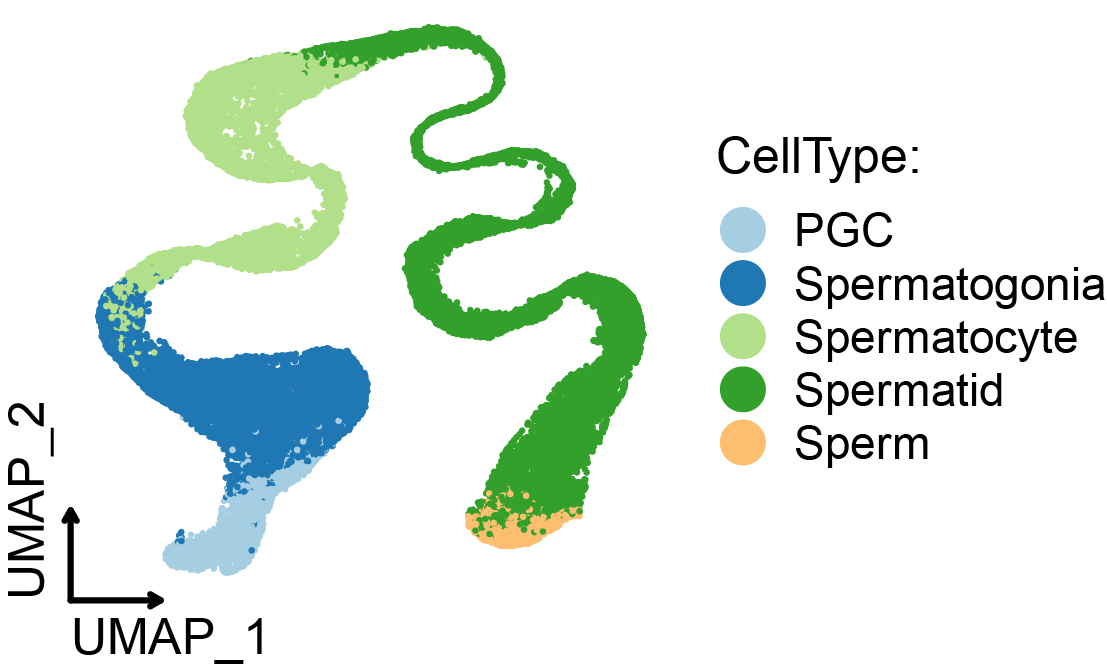
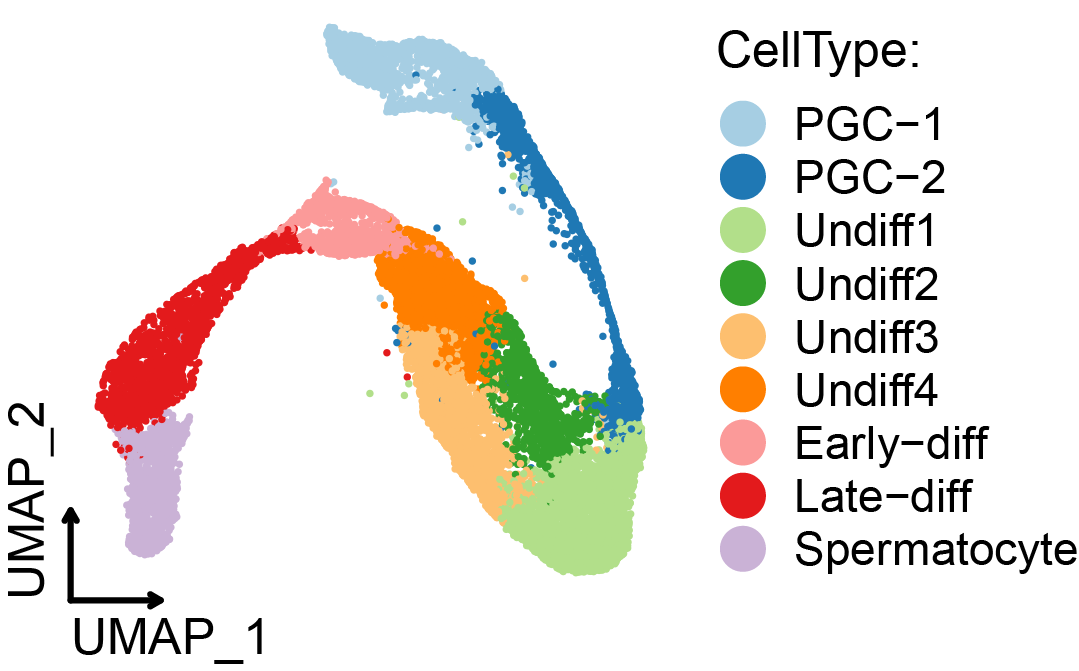
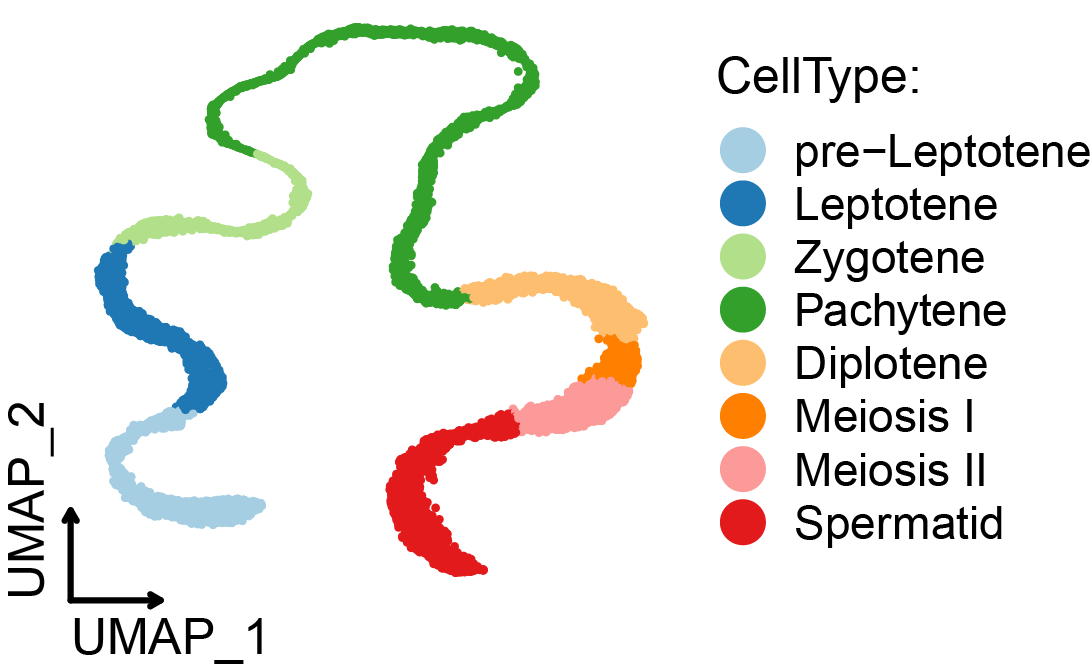
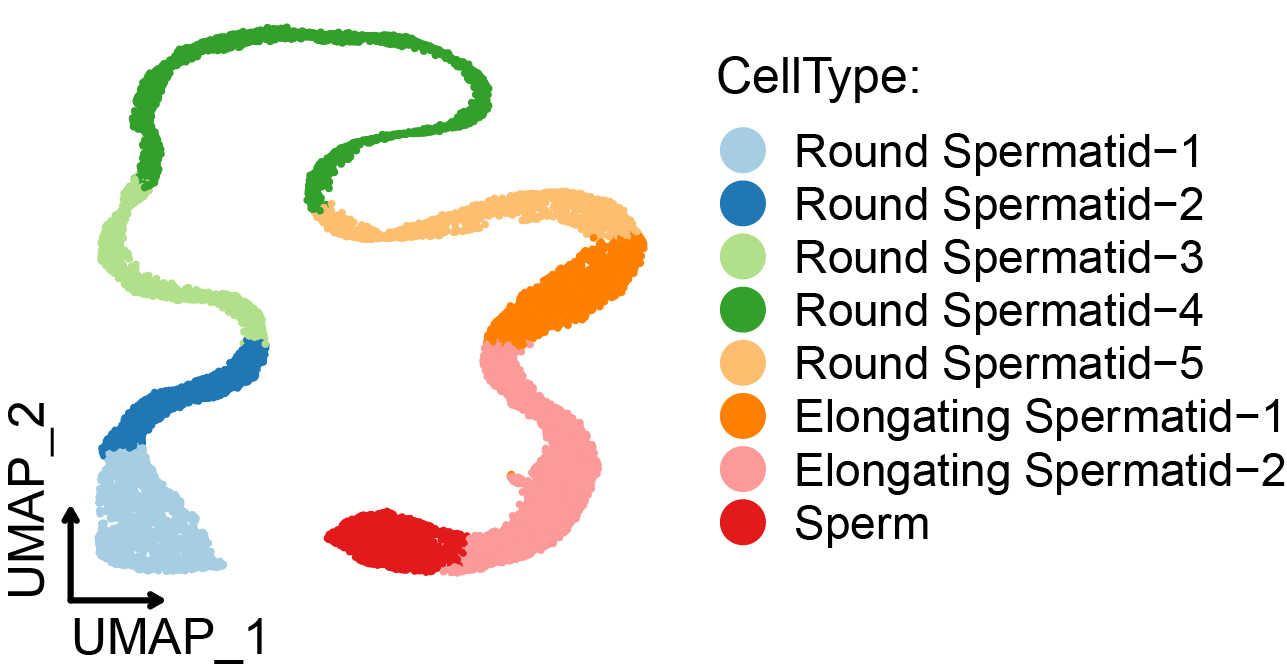
Parameter selection
Result
gene : Gene symbol
group1 : The first group
group2 : The second group "others" represents the other cell types in the dataset except for group1.
pct.1 : The percentage of cells where the gene is detected in the first group
pct.2 : The percentage of cells where the gene is detected in the second group
p_val_adj : Adjusted p-value, based on bonferroni correction using all genes in the dataset
avg_log2FC : log fold-chage of the average expression between the two groups Positive values indicate that the gene is more highly expressed in the first group.
TF : Whether the gene plays a role as a transcription factor/transcription factor cofactor "TF" or "TF cofactor" or ""
SP : Whether the protein encoded by the gene is located on the cell surface "SurfaceProtein" or ""
Enzyme : Whether the gene plays a role as a Enzyme "types of enzyme" or ""
| Column 1 | Column 2 | Column 3 | Column 4 | Column 5 | Column 6 | Column 7 | Column 8 | Column 9 | Column 10 |
|---|